GE Digital
Operations Performance Management - Performance Intelligence (OPM PI)
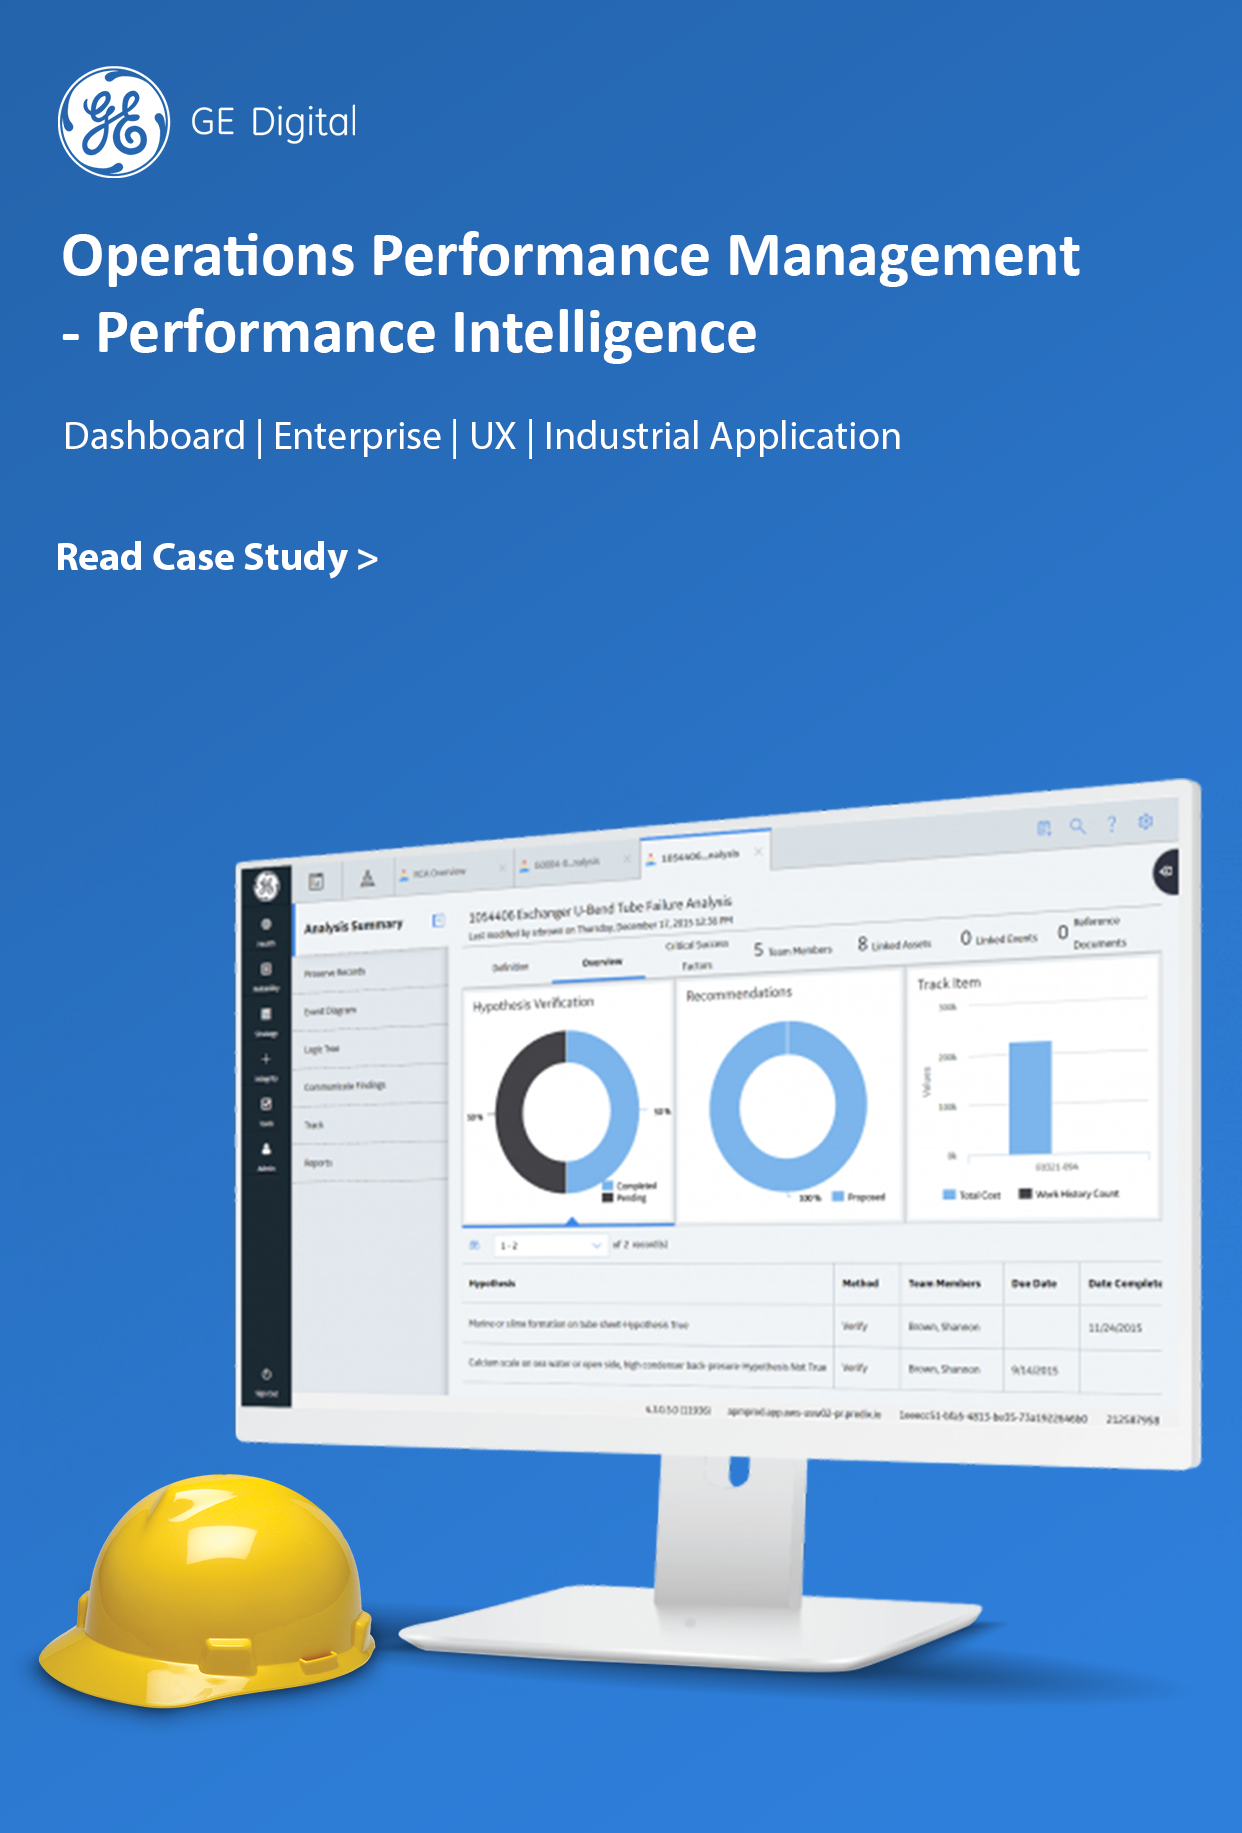
Operations Performance Management - Performance Intelligence (OPM PI)
OPM PI industrial dashboard application that provides an integrated single source of truth by giving comprehensive, timely and accurate data and tools. With a complete picture of the operations, maintenance and actual capability of a power plant, coupled with market and environmental conditions, it is possible to make decisions about dispatch that maximize revenues while reducing fuel and maintenance costs.
OPM PI lets the users increase revenue and margins with visibility, insights, decision support and advanced edge controls to optimize performance across their power generation fleet.
OPM analyses historical data, plant operations and other data sources to monitor and diagnose issues or areas of improvement, predict capacity and its cost to improve day ahead and intraday planning, deliver executable advice or close the loop and drive desired outcomes for improved efficiency, flexibility, capacity and emissions.
An industrial application for the power generation customers which lets them manage performance & operations, reduce fuel costs & emissions and recommends maintenance actions that improve performance.
Project Type
Enterprise Industrial Application for Powerplants
Organisation
Duration
Ongoing, 3 years
My role in OPM PI
As a sole UX designer of OPM PI, my responsibilities consist of:
Designing new features based on discovery sessions with stakeholders.
Optimising existing features by implementing the design process.
Defining user personae and respective workflows, understanding pain points.
Conducting feedback & usability sessions with customers.
Reorganising existing and new features based on customer workflows.
Implementing the design process in the product lifecycle and helping internal teams understand the value of the design process.
Working on development and evolution of the Design System and helping reduce development efforts and defects.
My work in OPM PI includes designing
Dashboards
Data Visualizations
Schematic & HMI screens
Data configuration pages
Analysis screens
Documentation screens
Various micro-apps
My work in OPM PI
OPM PI consists of many micro-apps and features that help the users with specific tasks. These features help customers with various operations of a power plant. Some of these features that I have worked upon are listed below
OPM PI - Dashboards
OPM PI dashboards is an operational and analytical dashboard which is also the landing page of the application. It gives an overview of production data, alerts, ambient conditions etc.
OPM PI - Thermal Performance
Thermal performance is a microapp that lets the users view performance and degradation data on a time series chart. Users can view this data on different levels like plant/block/asset. It also gives them actual vs expected production analysis at multiple plant loads.
OPM PI - Operations
Operations is a feature where the users can view different operations of the power plant on various levels. It shows data visualizations with detailed views on starts, load, output, heat rate, efficiency, fuel consumption, emissions, ambient temperatures etc.
OPM PI - Sensor Health
Sensor Health gives the users an understanding of the data quality. All the analytics throughout the application are based on data received from multiple sensors located on various assets of the plant. Sensor health lets users identify the health of these sensor or sensor groups and thus lets them know how reliable the data is.
OPM PI - What if
What-if is a data simulator that lets the users simulate various combinations of assets to achieve the required output and other metrics.
OPM PI - Advisors
Advisors is a feature that prevents failure and recommends maintenance actions in the plant. It also suggests an optimal time to perform the maintenance actions based on the relation between fuel cost and production loss.
As it is difficult to detail out all of my work with GED here, I have detailed one of the case-study where we redesigned the OPM PI application.

DETAILED UX CASE STUDY
OPM PI Redesign
Redesigning the UX of the OPM PI application to have an unfragmented seamless and faster workflow along with a revamped UI.
The Challenge
Power plant (or fleet) operations generate tonnes of data, this data is then consumed by multiple personae at various levels. OPM PI is a product that is made up of multiple micro-apps. Although these micro apps give a detailed view of the data, the users have to constantly keep pogo-sticking between screens, hierarchies, apps throughout their workflow.